Showing posts with label bear flag. Show all posts

Tuesday, December 20, 2011

TZA short, POT long


Simple bear flag formation. Short on the break of 3rd candle low.


I Like red, green, red bar for a short when the low is taken out but instead if it takes out the high, worth going long. TZA had the same pattern on 12/13. Pot had the same pattern on daily but today price took out high instead of taking out the long. I entered long just below PDH.

Thursday, September 22, 2011

BIDU, USO short


BIDU formed a beautiful bear flag. It was on my watchlist because of the daily. It was rejected near the 150 levels on Tuesday, followed by some consolidation on Wednesday. I was looking for some continued down movement today. First 2 bars nice red, followed by small retracement to meet the sloping 5 EMA. Formed a bearish candle. Entered short there. Nice ride down from there.


USO was my resistance setup.

Thursday, July 21, 2011

Short USO

I had a nice trade in CLF short early in the morning. Tried to short SLV after it rallied to the 50 EMA on 15 min. which ended in a loss. There was honestly no setup in the silver short trade. Also entered USO short. Since USO was not available for shorting , I shorted OIL which does not have much volume but I am posting the USO chart because I was following USO chart for entry and exit.


USO formed an inside bar just below R1, took out R1 but failed to take out PDH. It moved to the major EMA's and formed a bear flag on the EMA. I shorted on the break of the bear flag and price immediately broke down nicely. Love when the trades work immediately and better than expected.

Wednesday, April 28, 2010

CAKE, AMZN - scalp

Gapped down. First bar left a long lower tail. 2nd bar is an inside tailed candle closing weak and also closing below S2. Entered short on the 3rd bar. Soon after the entry price retraced to the 5 EMA in narrow range bars on low volume forming a bear flag. Like this type of retracement. Added to the position on the break of the flag. Exited when price moved above 5 EMA after forming bullish candles.


AMZN - scalp trade. This was meant to be a scalp trade from the start. AMZN was relatively weak from the open. 2nd bar was a doji. 3rd bar opened below the close of the 2nd bar. Entered short therewith the high of the 2nd bar as SL and $140 as the target.

Had a loser in GS. Looked like t it was forming a bull flag and entered the trade even with the overhead 5 day EMA as resistance.

I took a swing position in GG yesterday on the break of the base but sold today.

Thursday, October 8, 2009

CLF - NR7, Inside Bar on Daily


Yesterday CLF formed a NR7, inside bar within the tail of the previous bar on the daily chart. It was green on green and on very low volume. This have a high probability of an expansion move coming soon. CLF was on my focus list today. It gapped up above R2 today, moved sideways to reach the rising 5 EMA. 3rd bar closed very strong. Entered on the 3rd bar. It consolidated midway where I could have added to my position. Sold at $35.60.


This was yesterday's trade. Found resistance from all the EMA's. In this setup, stocks move up against the EMA's. Candles become narrower forming a bear flag. Best entry is on the break of the trendline.

Monday, August 10, 2009

RIMM, SPY

Done for the day today. Had 2 small losers in DISH and ENER. Both were long. The short trades worked out as planned.


SPY formed a bear flag against 20EMA and daily pivot. 7th bar was a NR7 and inside bar. Shorted when the low of the 6th bar was taken out. Covered completely near the 5 DMA, PDL & S1.


Price below PDL. Formed a bear flag against the 5 EMA. 6th bar was NR7. Entered short on the break of the 6th bar low and covered completely a few pennies above 50%FE measured from day's high to the break of the consolidation.

Wednesday, July 29, 2009

Flag Day

A mixed day. What was good? I had 2 pretty decent trades in APOL and WLT. In WLT, I even added to my position which I normally do not do. Bad? because I had 2 losers and both of them were because I did not adhere to my trade guidelines. I have made those basic mistakes in the past and promised myself not to repeat them again but I did. I am really ashamed. If I don't learn from my mistakes, I will never move forward in trading. Really disappointing.
On to the winning trades.

WLT gapped down and formed a bear flag just above the PDL. Entered on the break of 3rd bar low, below PDL with an iniital target S2. Price moved again and formed another bear flag against 5 EMA. Added to my position on the break of 7th bar low.  Changed my target now to 100% FE of the 2nd bear flag measured from the top of the 4th bar to the 7th bar high. 
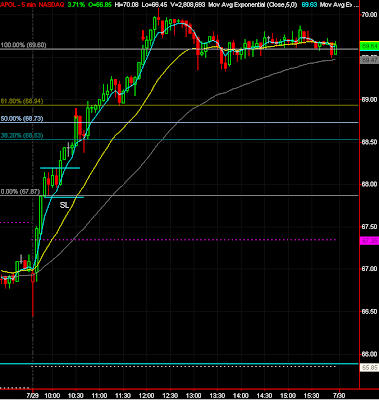
 APOL opened inside PDR (previous day range) and rallied after the open and moved avove PDH. It then consolidated above ORH (15 min.) forming a bull flag. Entered on the break of the bull flag. Took partial at 50% FE. I was expecting some retracement and moved the SL on remaining to BE. Price moved up nicely to reach 100% FE of the bull flag where I sold the remaining position. 

Tuesday, July 28, 2009

POT, FSLR

Just 2 trades to blog. Decided to call it a day after that. Missed CELG on the break of 4th bar high. I saw when price had already moved some distance and did not wanted to chase it.

SPY gapped down and rallied up immediately after the open but POT sold off and closed below PDL but had a lower tail. 2nd bar was a doji inside bar.  Entered on the break of the 2nd bar. This was a risky trade because of the 5-day EMA and $94 support just below it. Price sliced through the support on high volume and closed very weak. It then formed a bear flag and I exited completely at S2.
 

FSLR gapped below PDL and tried to rally with $SPX but found PDL and 5 EMA as strong resistance and sold off hard. 4th and 5th bar consolidated near the ORL and on low volume. Entered short on the break of 5th candle low. Took partial at 50% FE measured from the top of the 3rd - 5th bar low. Covered the remaining a little above 100% FE.

Wednesday, June 17, 2009

Bear Flag - SRS


SRS formed a nice bear flag around 1pm with PDH acting as resistance. I was watching the bear flag formed but when it took out the low of 15the candle, I was looking at some other stocks. I entered when price was about to take out the low of the 14th candle. Entered short there and covered a little above daily pivot (yellow dotted line) which was also the 100% FE of the flag.  

Wednesday, June 10, 2009

Bear Flag - BIDU


Simple bear flag setup. Price below 5 and 20EMA.  4th candle was bullish but failed to close above the sloping 5EMA. 5th candle was very weak closing at it's low. Short there and covered at 50% FE of the pattern.

Monday, June 1, 2009

SRS - Bear Flag


SRS formed a bear flag. I noticed it on the 5 min. chart. It formed a nice doji at 5 EMA on 15 min. chart. Short on the break of the low and covered entire position a little above 50% which was $17.

Monday, April 6, 2009

BTU


BTU opened weak forming a weak WRB. 2nd and 3rd bar started retracement and hit the sloping 5 EMA which provided resistance. Entered on the break of 3rd bar low. partial at ORL and exited at 38% FE.

Thursday, March 19, 2009

MS - Bear Flag


MS was weak from the start and sold fast. 3rd candle started retracement on lower volume to the sloping 5 EMA which acted as resistance.  5th candle is NR7. Entered short on the break of 5th bar low. All the EMA's were aligned bearishly.

Target: Took partial at swing low. Exited completely at 38% fib. extension drawn from ORH to ORL (based on h pattern)

Thursday, July 31, 2008

Dummy Gapper Trade - MasterCard Inc. (Public, NYSE:MA)


MA gapped down on earnings but soon retraced retraced 25% of the gap. It then formed a bear flag on a 5 min. chart. Shorted MA on the break of the flag. On it's descent, MA also formed bearish descending triangle. With the market being weak, I had a feeling that MA would try to touch the $240 mark which also coincided with the fib. extension. After hitting $240 mark, it formed bullish candles. Covered my entire position at $241.xx.